The signal tracer lets you trace a signal or a set of signals in a Simulink model, so that you can identify how various components of a model are affected by the others. Tracing signals in Simulink has never been so powerful!
Tracing an input
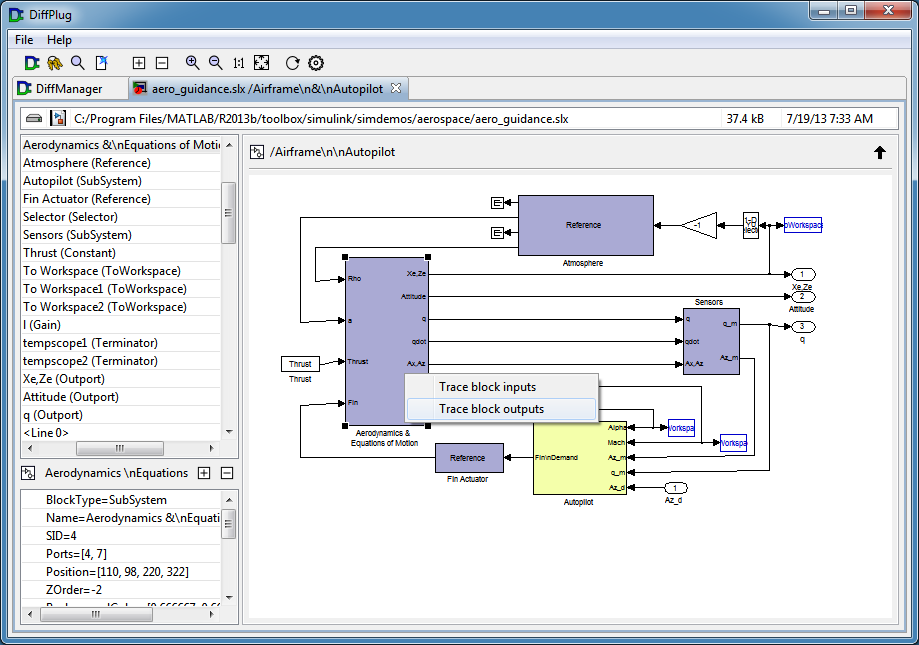
To initiate a trace, simply right-click the block or signal you wish to trace. You may right-click in the graphic view, or in the model tree at the left.
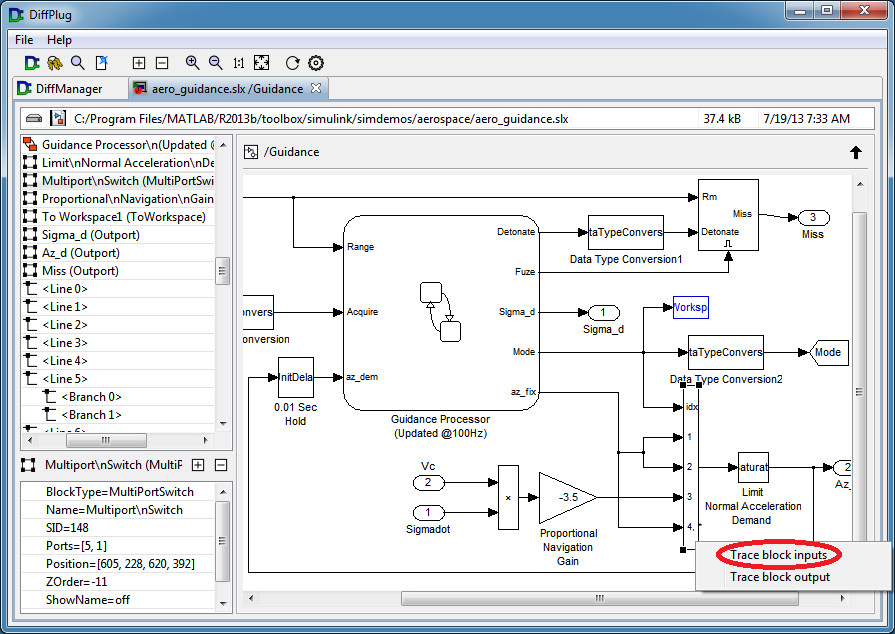
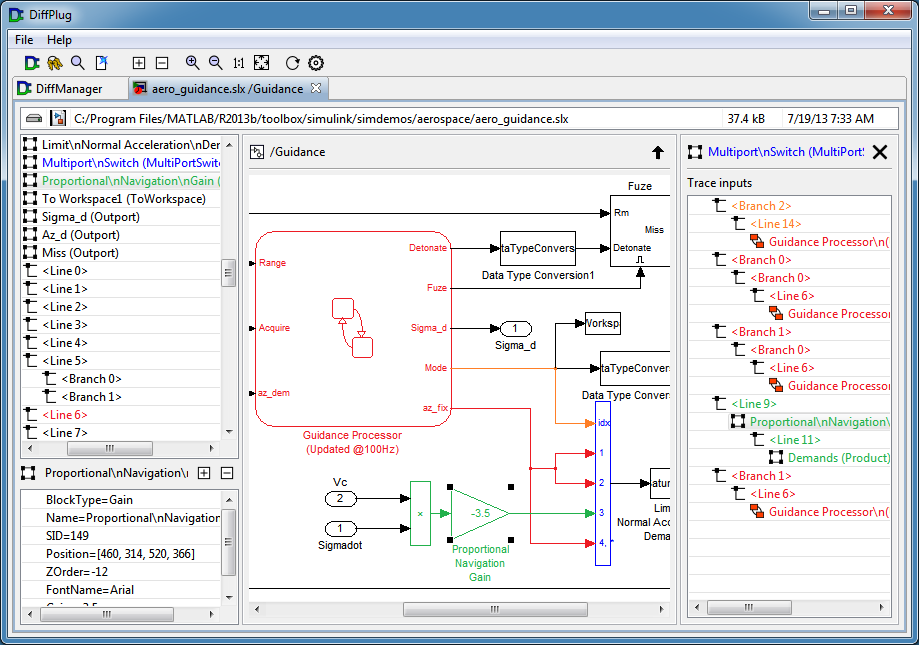
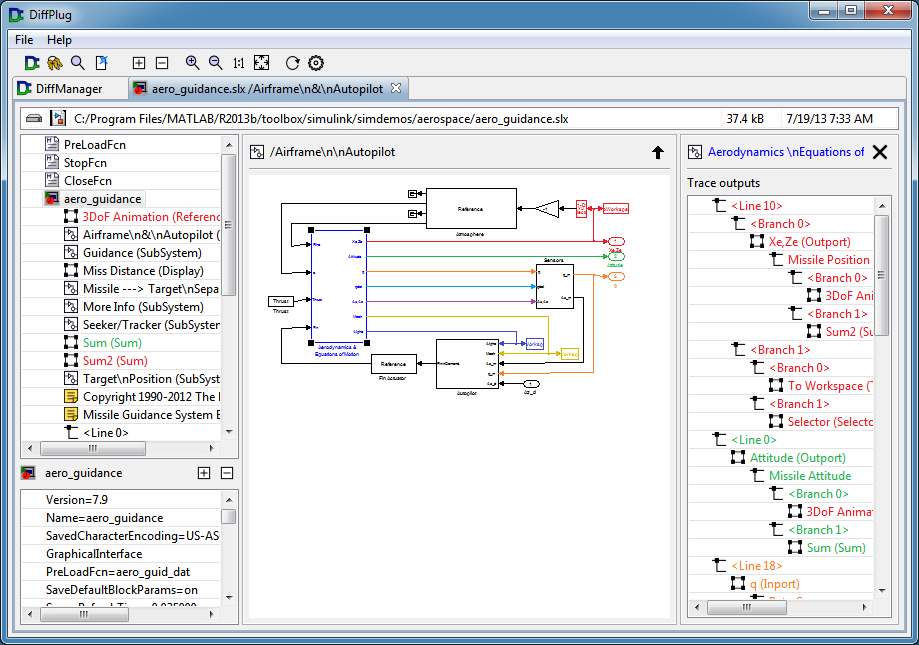
Once you’ve selected which direction you want to trace, the trace pane will show up on the right.
At the top of the trace pane is the block or signal that you are currently tracing. Below this is a tree which shows all of the elements in each trace.
If two signals are really just branches of the same source, then they will be the same color. In the example below, all of the signals that come from the az_fix port are red, because they all have the same value. The colors are synchronized between the graphic view, model tree, and the trace pane.
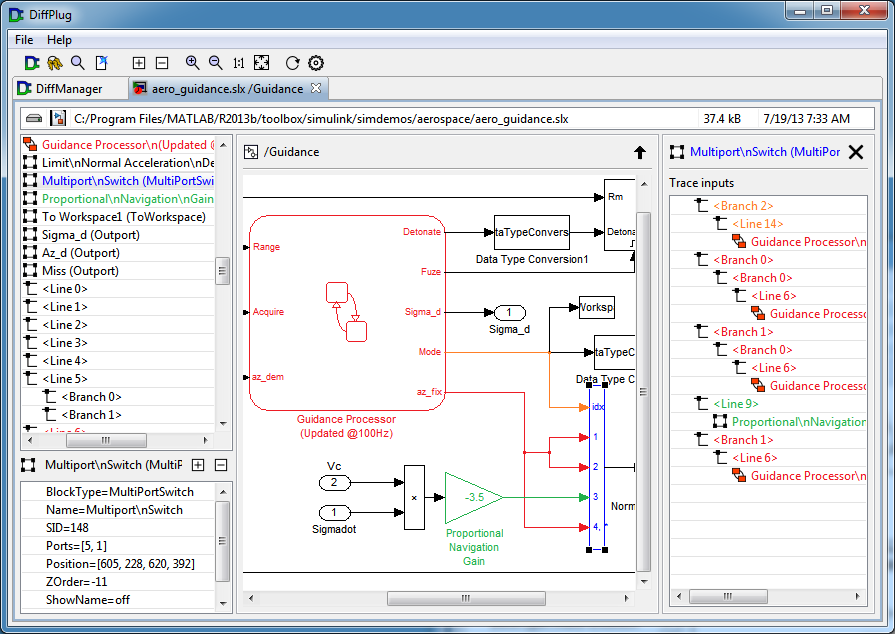
If a block has more than one port, it’s possible that the block will intersect with traces of more than one color. In this situation the block will show only one of these colors, even though it is really a combination of multiple colors. In the example above, the Guidance Processor Stateflow block is colored red, even though it’s really producing both red and orange outputs.
Extending a trace
If a trace does not go as deep into the model as you would like, you can extend it. Simply right-click the block you would like to extend the trace along, and select Extend traced input (or output, as appropriate).
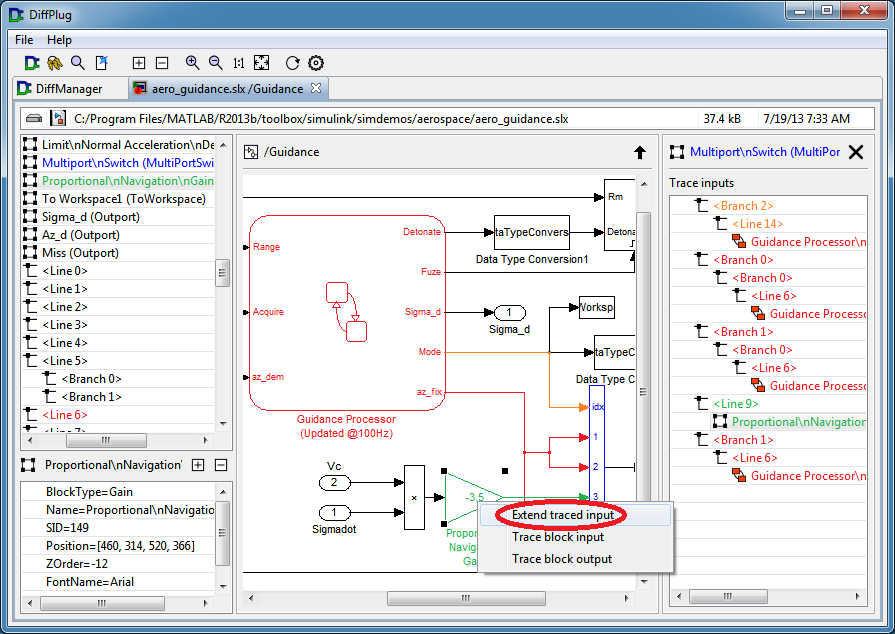
Notice that this extension caused the route tree at the right to grow. But we still don’t know where the signal comes from after it leaves this subsystem…
To fix this, we can extend the trace once more. Traces will automatically pass through Goto and From blocks, as well as Subsystems and all of their Inport and Outport blocks. However, as soon as a trace hits any other kind of block, the trace will stop.
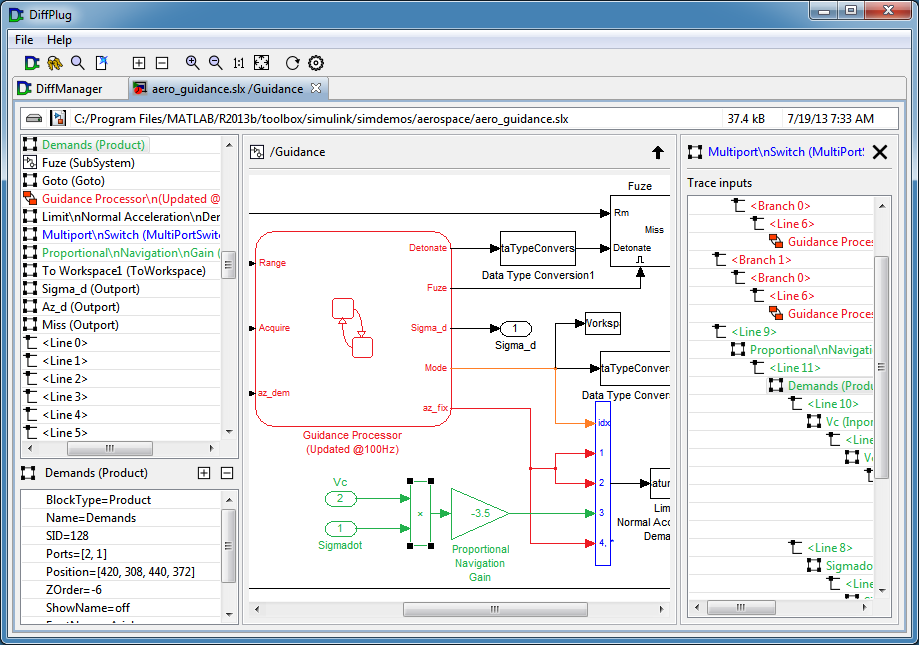
Notice that even though the multiplication block causes a branch, both are colored green. This is because we are still tracing with respect to the blue multiport switch. Everything in green feeds into a single input of the multiport switch.
Following a trace
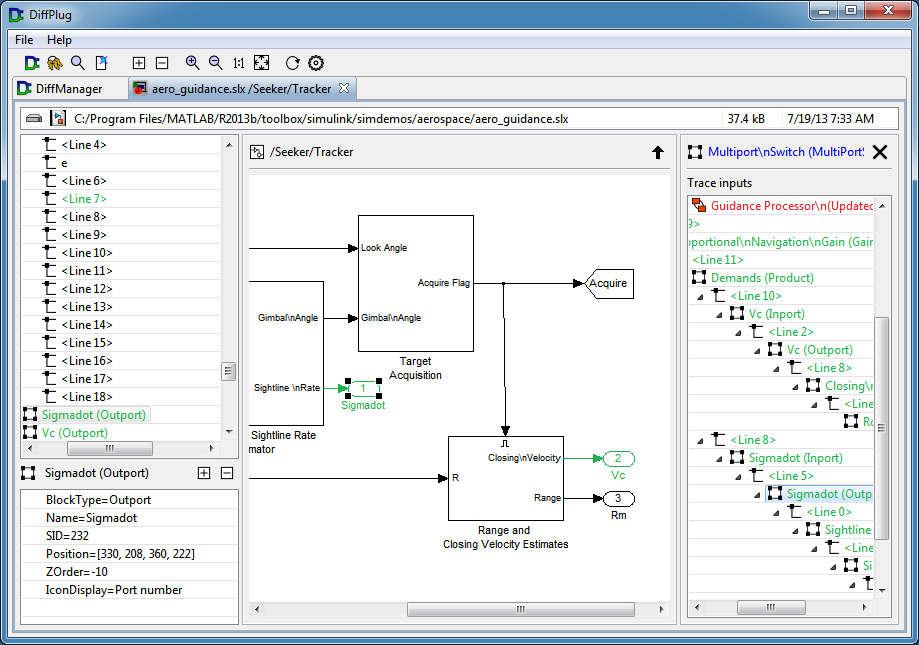
Also, notice how much bigger the route tree got. These inputs pass through several subsystems before they reach their true sources, which makes them difficult to follow by hand. However, the trace pane makes this task easy - single-click an element to select it, or double-click an element to open it. We can double-click our way down the tree to follow the data flow for either of the inputs.
Here they’re still in the same system.
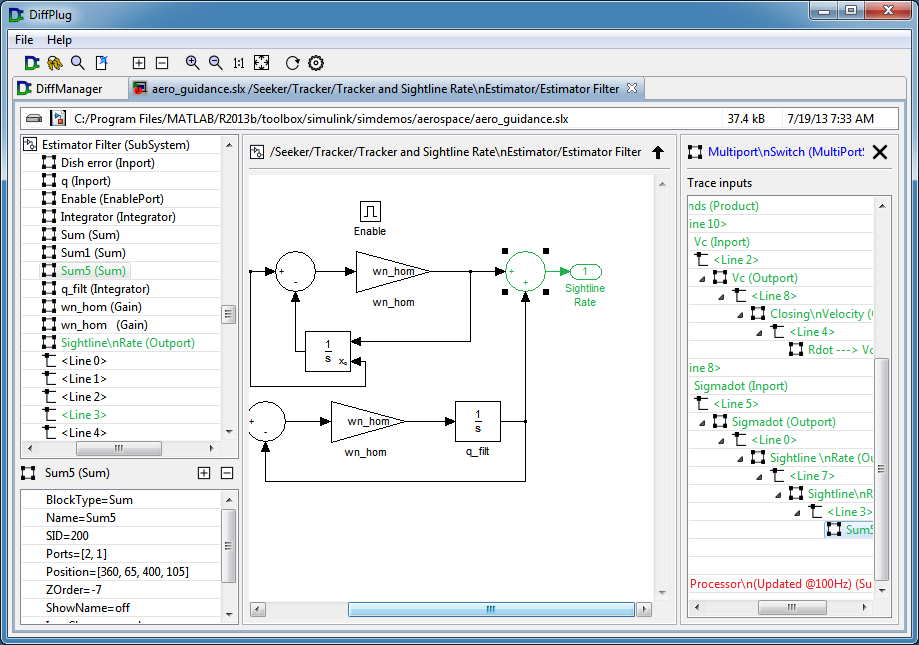
And here we’ve zoomed in on just one of them.
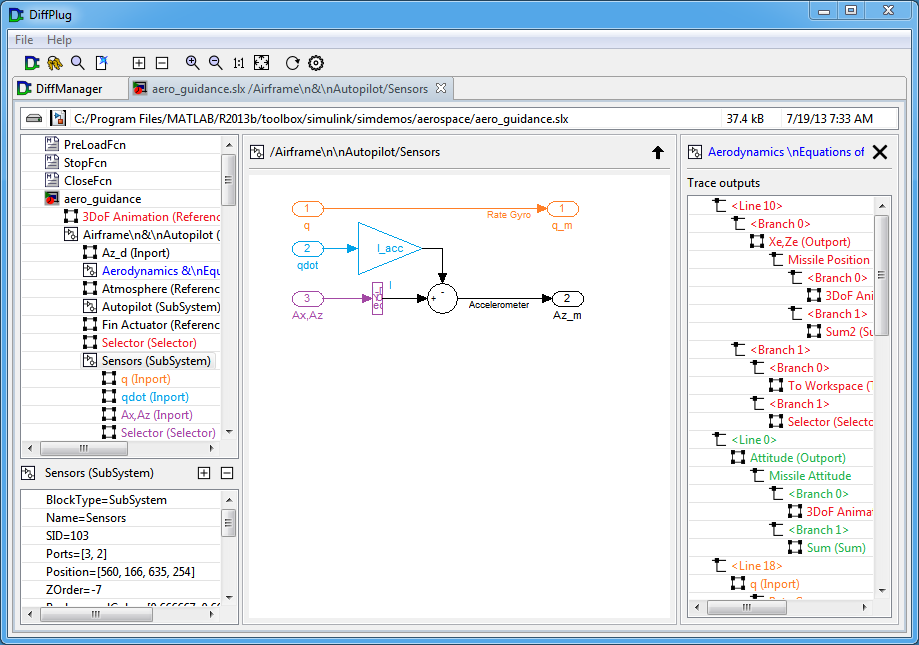
Another example
In this example, we’ll attempt to make sense of this complex subsystem by tracing the outputs of the Aerodynamics & Equations of Motion block.
Note that the orange signal appears to pass through the Sensors subsystem unmodified.
Zooming in, we can see that this is the case.